Inside Phasmida Smart Cloud: Managing Biosystems, Devices and Pairing
Phasmida Smart Cloud: Inside the Interface That Connects Biosystems, Devices, and Daily Operations
Phasmida Smart Cloud is the software layer that turns connected biosystems into something operators can actually manage at scale. It brings together monitoring, device identity, operational status, and cloud-based control in a single interface designed for real-world use, not just raw telemetry display.
From a hardware perspective, the model is straightforward. Devices installed in the field collect data, report their status, and communicate with the cloud through secure API-based connectivity. Those devices may be bundled Phasmida units delivered ready for onboarding, or external compatible hardware integrated by the customer. In both cases, the cloud acts as the coordination layer: it stores system identity, organizes biosystems, manages device relationships, and presents everything in a usable operational view.
That is the real purpose of Phasmida Smart Cloud. It is not only a backend for connected hardware. It is the interface through which users understand what is happening, decide what to do next, and maintain control over distributed biosystem infrastructure.
This article focuses primarily on that interface: how the Smart Cloud is structured, what each major section does, and how users move from overview to detail, from biosystems to devices, and from packaged hardware to custom deployments.
What Phasmida Smart Cloud Is
At its core, Phasmida Smart Cloud is a management and visibility platform for connected biosystems. It gives users a central place to work with environments, field hardware, and system-level status without needing to interact directly with lower-level infrastructure.
In practical terms, the platform serves several roles at once:
- it provides a live operational overview,
- it organizes biosystems as manageable units,
- it tracks devices and their cloud identity,
- it supports secure pairing and onboarding,
- it creates a common operating surface for both standard and custom hardware.
That combination is what makes the platform especially relevant in multi-site or multi-device deployments. Without a unified interface, users are forced to piece together system state from separate tools, local dashboards, installation notes, and device-level utilities. Phasmida Smart Cloud replaces that fragmentation with one coherent environment.
The result is a platform that is useful both for day-to-day operators and for administrators responsible for growth, maintenance, and integration.
How the Platform Works in Context
Although the interface is the focus, it helps to understand the operating logic behind it.
Each biosystem consists of one or more connected devices operating in a real physical environment. Those devices may include controllers, sensors, camera-enabled units, and other connected modules, depending on the deployment. They send telemetry, status information, and identification data to the cloud, while the cloud stores structure, access, and operational context. The interface then translates that underlying device activity into readable, organized workflows.
This is an important distinction. Users are not interacting with abstract cloud records. They are interacting with live digital representations of real installations. A dashboard card, a biosystem page, or a device detail view is not just UI decoration; it is the user-facing expression of hardware installed in the field.
That is why good structure matters. A strong cloud interface does more than display numbers. It reduces ambiguity, speeds up response time, and makes scaling possible.
Dashboard: The Operational Starting Point
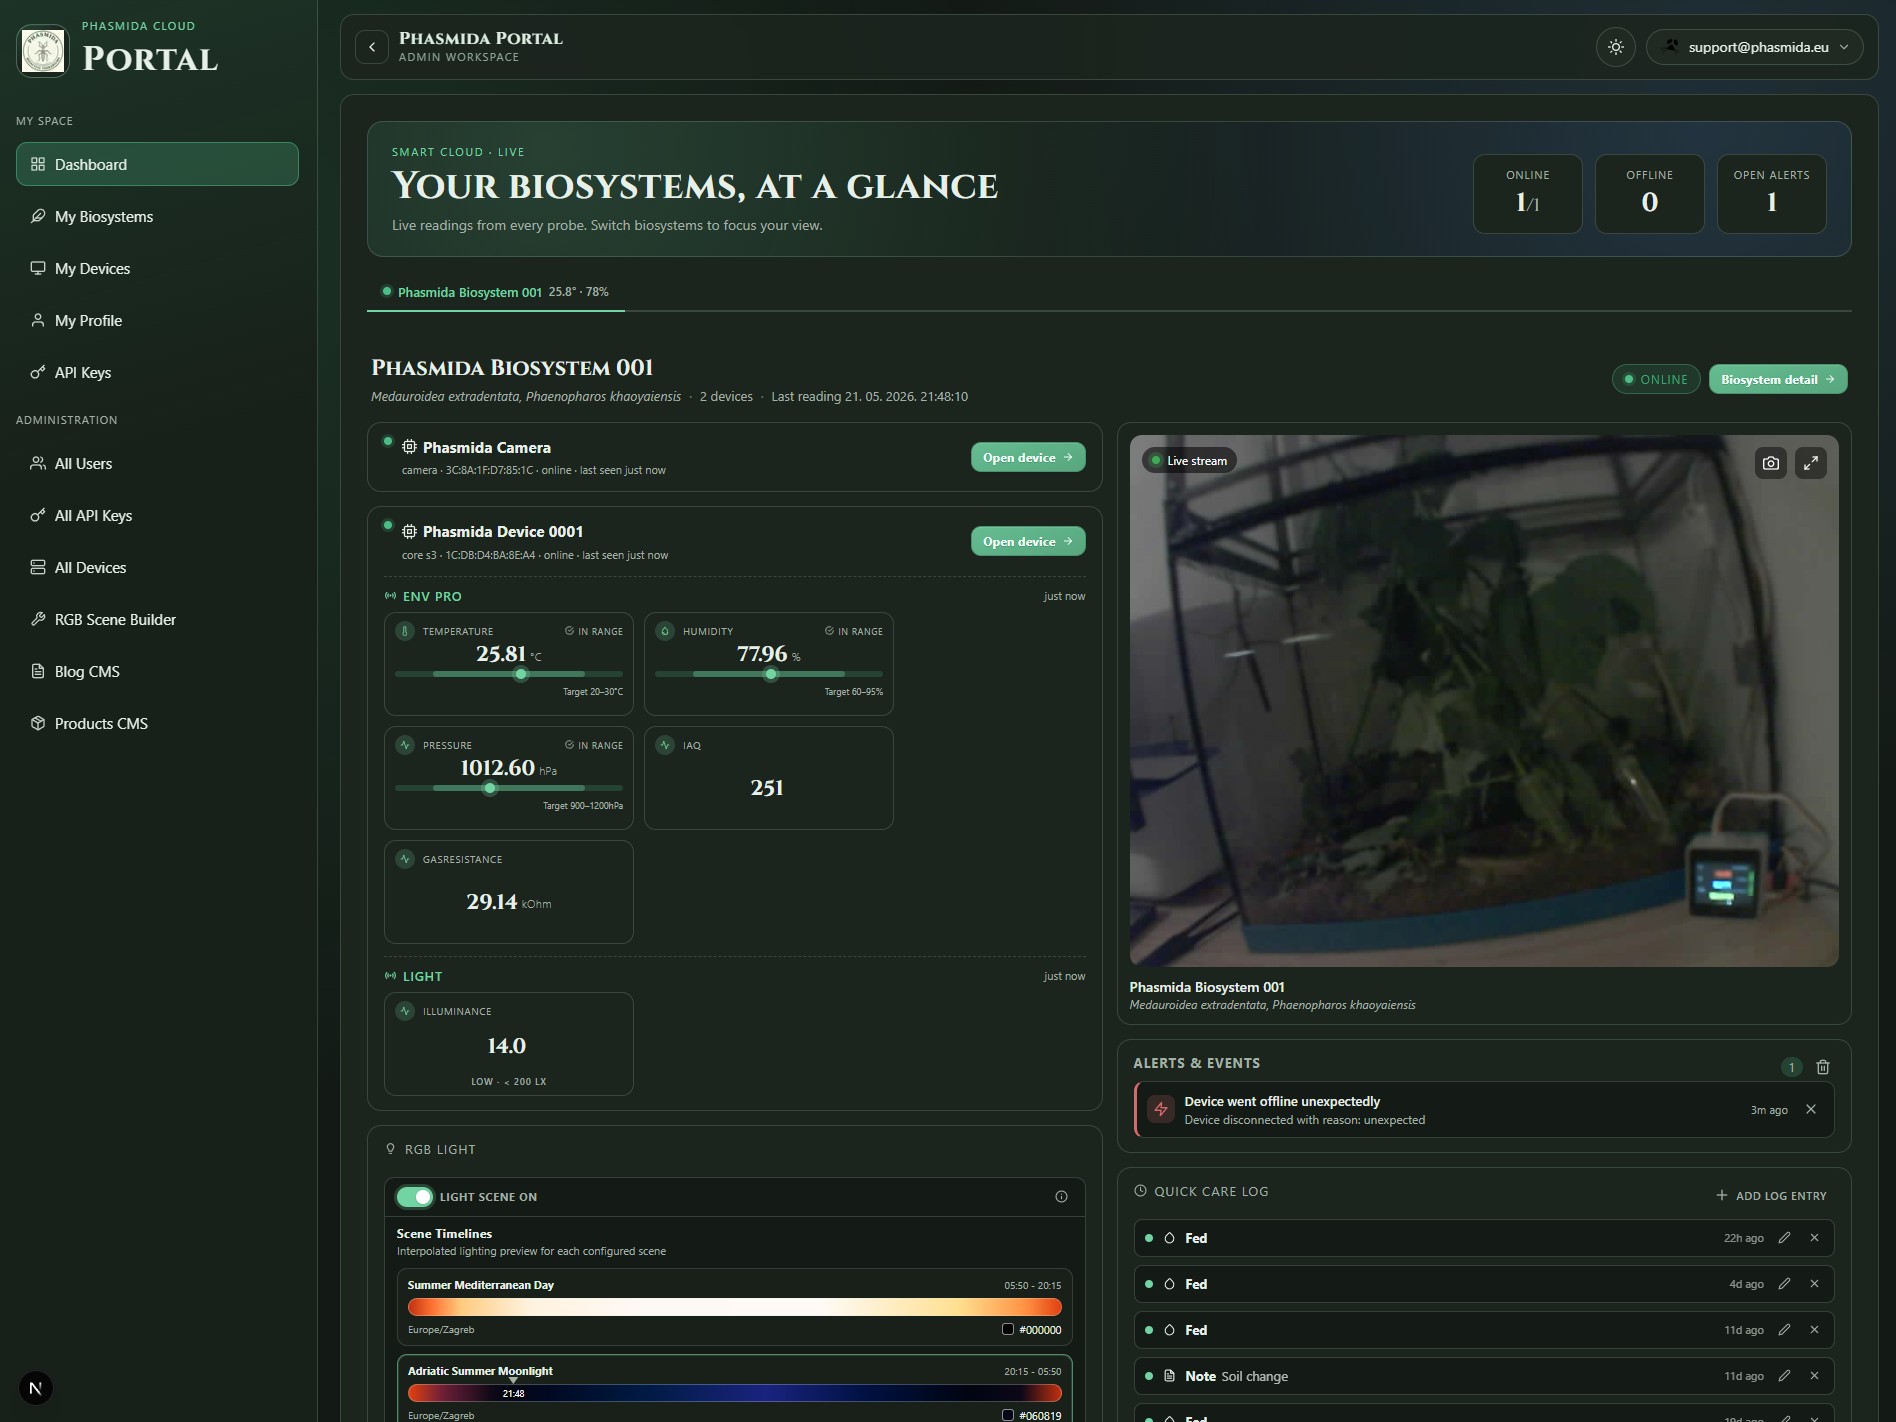
The Dashboard is the first layer of understanding inside Phasmida Smart Cloud. Its role is simple but critical: give the user a fast, reliable overview of what matters right now.
In many technical platforms, the dashboard becomes a dumping ground for widgets. Here, it should be understood more strategically. The Dashboard is the user’s command summary. It is where the platform answers the first operational questions before the user drills deeper into any specific biosystem or device.
Typically, that means the Dashboard helps users identify:
- the current overall state of their systems,
- whether all expected biosystems and devices are present and healthy,
- whether there are alerts, exceptions, or abnormal conditions,
- where attention may be required first.
For a single installation, that makes everyday use faster. For multiple installations, it becomes essential. Operators should not have to inspect each biosystem manually just to establish whether the network is functioning normally. The Dashboard reduces that overhead by concentrating the most relevant signals into a single starting view.
From an editorial perspective, the best way to describe the Dashboard is as a platform for immediate situational awareness. It is the screen that transforms cloud connectivity into operational confidence.
What the Dashboard communicates well
The Dashboard works because it compresses complexity without hiding meaning. A good dashboard does not replace detail pages; it prepares the user for them. In Smart Cloud, that means the Dashboard should be read as a triage and orientation layer.
It supports three practical needs:
- fast recognition of system status,
- prioritization of attention,
- quick transition into a more detailed workflow.
This is especially valuable in biosystem environments where timing matters. If a device goes offline, if a subsystem behaves unexpectedly, or if a change in environmental conditions requires follow-up, the Dashboard is where that operational story begins.
Suggested screenshot placement:
- Dashboard overview
- summary widgets or cards
- alerts, notices, or recent activity section
My Biosystems: From Global Overview to Structured Environments
If the Dashboard gives users the big picture, the My Biosystems section is where the platform becomes specific.
This section organizes each biosystem as its own manageable operational entity. That matters because users are not only managing devices; they are managing environments, installations, or customer-specific setups in which those devices operate. A biosystem is the meaningful real-world context. It is the level at which monitoring, interpretation, and action start to become truly useful.
The My Biosystems view therefore does two things at once:
- it gives the user a structured list of available biosystems,
- it creates a clean path into the detail page of each individual system.
For growing deployments, that structure is fundamental. Once a user moves beyond a single site or a single hardware cluster, clarity of grouping becomes just as important as the telemetry itself. Smart Cloud addresses that by giving each biosystem its own identity and its own space in the interface.
Why this section matters
The strength of My Biosystems is not just that it lists environments. Its strength is that it preserves operational meaning. Instead of asking users to infer relationships from device IDs or raw technical metadata, it lets them work at the level that matches how the deployment is actually understood in the field.
That improves both usability and decision-making. Users do not have to remember which device belongs where, or piece together context from scattered records. The system already provides the grouping.
In a practical sense, My Biosystems is where the platform shifts from cloud administration to environment-centric operations.
Suggested screenshot placement:
- My Biosystems overview list
- biosystem cards or rows
- high-level state indicators per biosystem
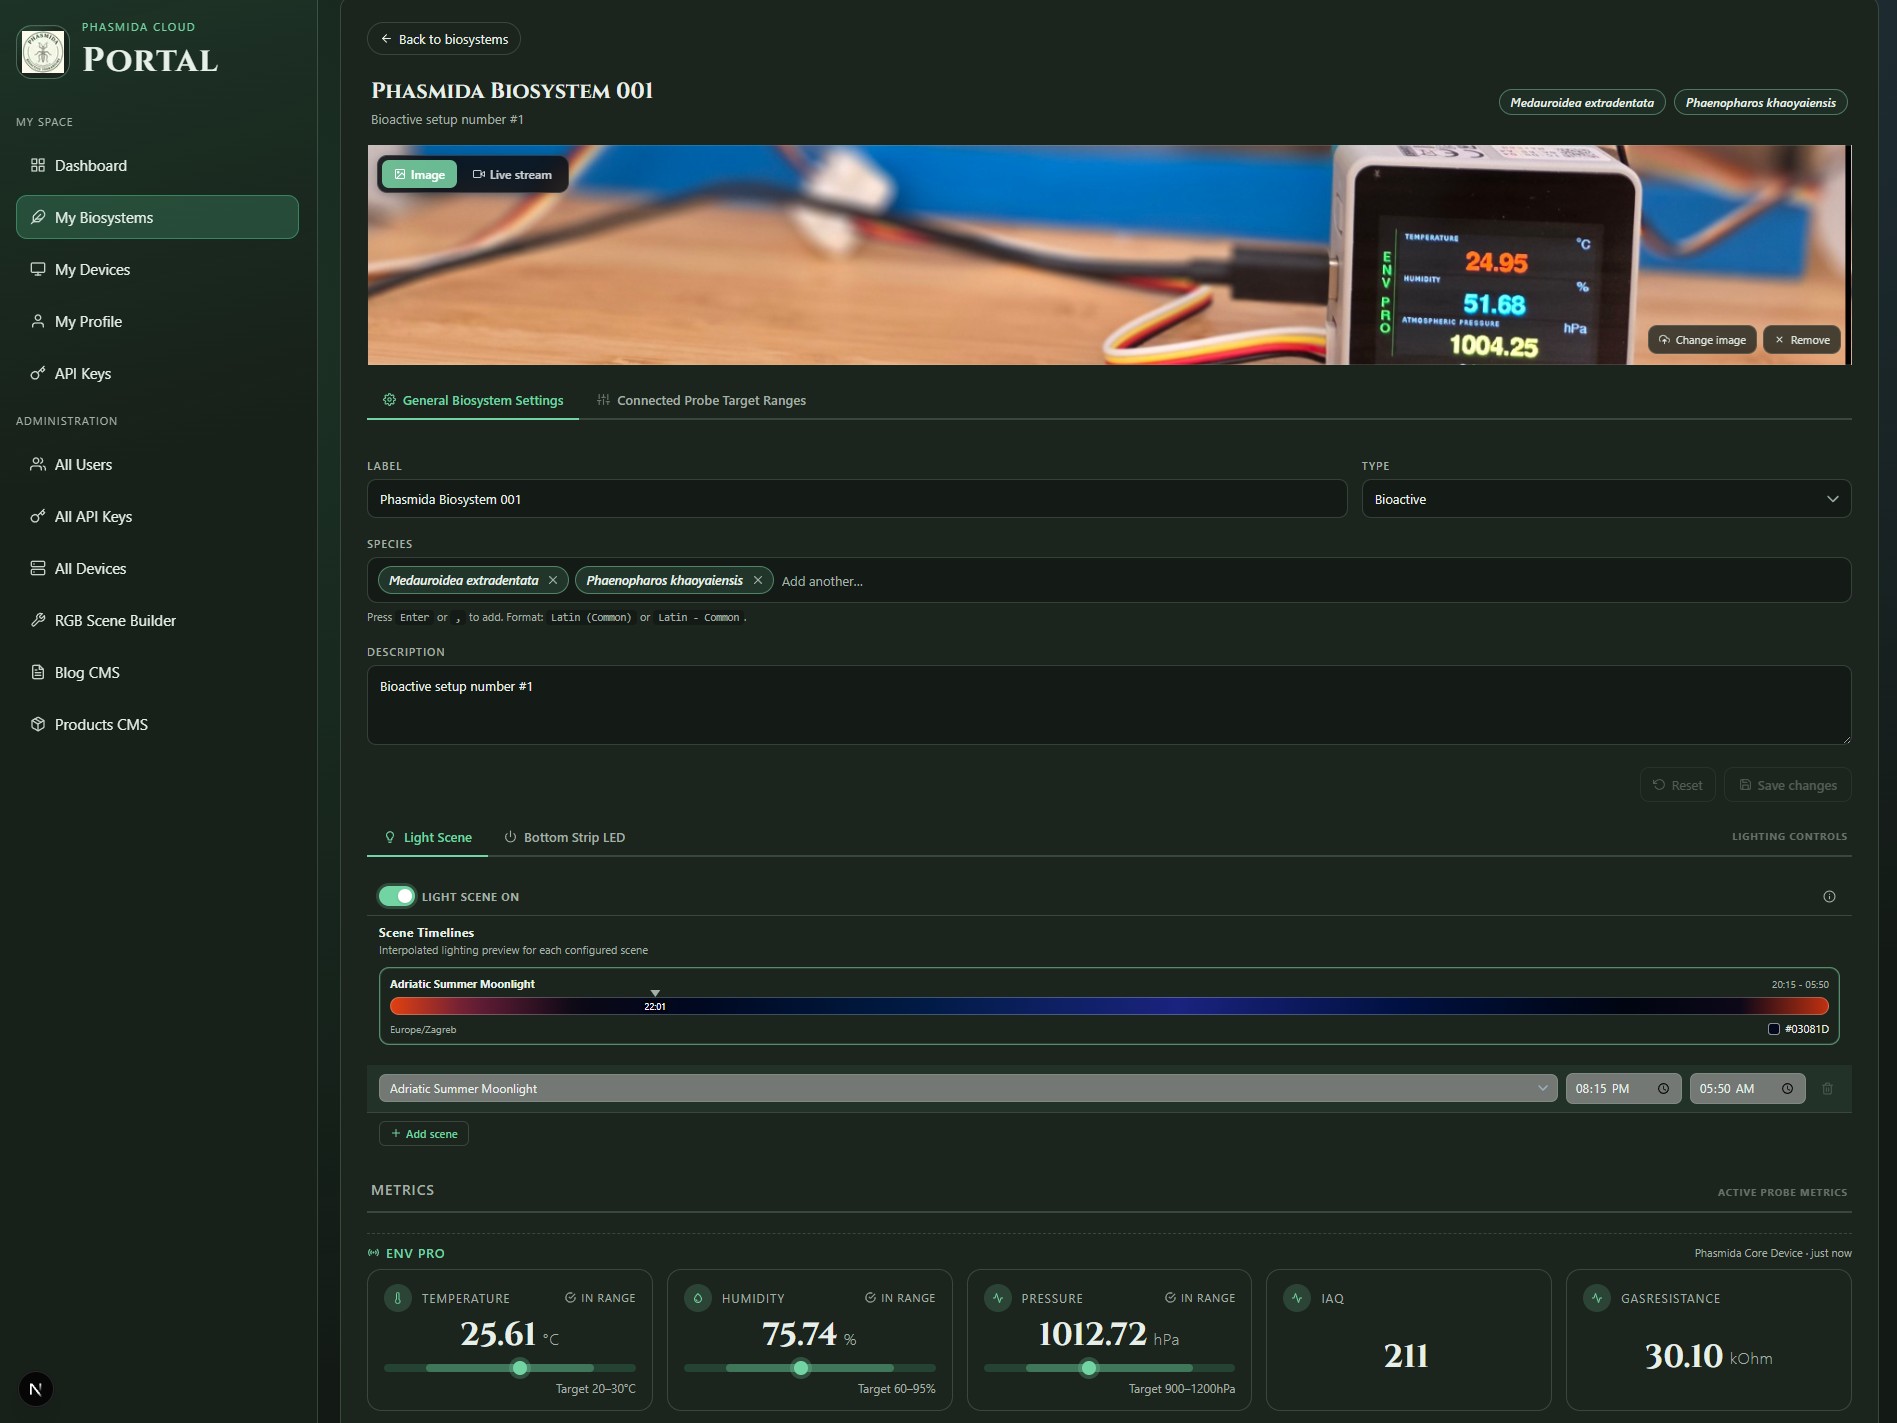
Biosystem Detail: Where Monitoring Becomes Actionable
The biosystem detail page is one of the most important surfaces in the entire Smart Cloud experience. This is where a user stops looking at the platform as a collection of entities and starts working with a specific living system.
Once inside a biosystem, the interface becomes narrower, more focused, and more operational. The questions it helps answer are concrete:
- What is the current state of this biosystem?
- Which devices belong to it and what are they reporting?
- Has anything changed recently?
- Is intervention required?
This is also the point where Smart Cloud shows its value as more than a registration portal. A well-designed biosystem detail page brings together the information users need to assess conditions and act without losing context.
Depending on the deployment and permissions model, that may include:
- current readings or live status,
- recent events or operational logs,
- device associations,
- visible system health indicators,
- direct access to actions or controls relevant to that biosystem.
What makes this view especially effective is the fact that it keeps the user grounded in one environment while still exposing multiple layers of information. The user is not thrown back and forth between abstract admin screens. They remain inside the biosystem context while moving from summary to detail.
That continuity is a major usability advantage. In operational software, context switching is expensive. Smart Cloud reduces it by structuring information around the biosystem as the primary working object.
A more human way to read the biosystem page
From a journalistic standpoint, the biosystem detail page can be described as the place where the cloud stops being conceptual and becomes local. Even though the data comes from remote devices and cloud services, the page feels tied to one physical environment. That makes the experience more intuitive for technicians, operators, and customers alike.
Instead of confronting users with infrastructure complexity, it answers a much simpler need: show me this system, show me its state, and let me understand it quickly.
- biosystem detail header
- live metrics or status area
- recent activity, logs, or control panels
- associated device section
My Devices: The Technical Backbone of the Platform
While My Biosystems organizes the platform around environments, My Devices organizes it around the hardware itself.
This is the section where users can review the devices connected to their account, inspect their identity and state, and manage the hardware inventory that powers the wider biosystem network. If My Biosystems is the operational view, My Devices is the infrastructure view.
That distinction is useful because real deployments require both perspectives. Users need to understand environments, but they also need a place to verify the status and lifecycle of the devices behind those environments.
In practice, the My Devices area typically supports tasks such as:
- reviewing all registered devices,
- confirming whether a device is connected or available,
- checking device identity and assignment,
- preparing new hardware for onboarding,
- tracing which hardware belongs to which deployment context.
This page becomes particularly important in larger installations, maintenance workflows, and support scenarios. When a system issue originates at hardware level, users need a direct device-centric view rather than only a biosystem-level summary. My Devices provides that operational depth.
Why the device layer matters
The presence of a dedicated device layer tells us something important about the maturity of the platform. Phasmida Smart Cloud is not treating hardware as invisible background infrastructure. It recognizes device identity as a first-class part of the system.
That has direct benefits:
- onboarding becomes cleaner,
- troubleshooting becomes faster,
- ownership and assignment are easier to verify,
- hybrid deployments are easier to manage.
This last point matters especially because the platform supports both standard Phasmida hardware and externally integrated compatible hardware. Once that flexibility exists, a strong device management layer is no longer optional. It becomes necessary.
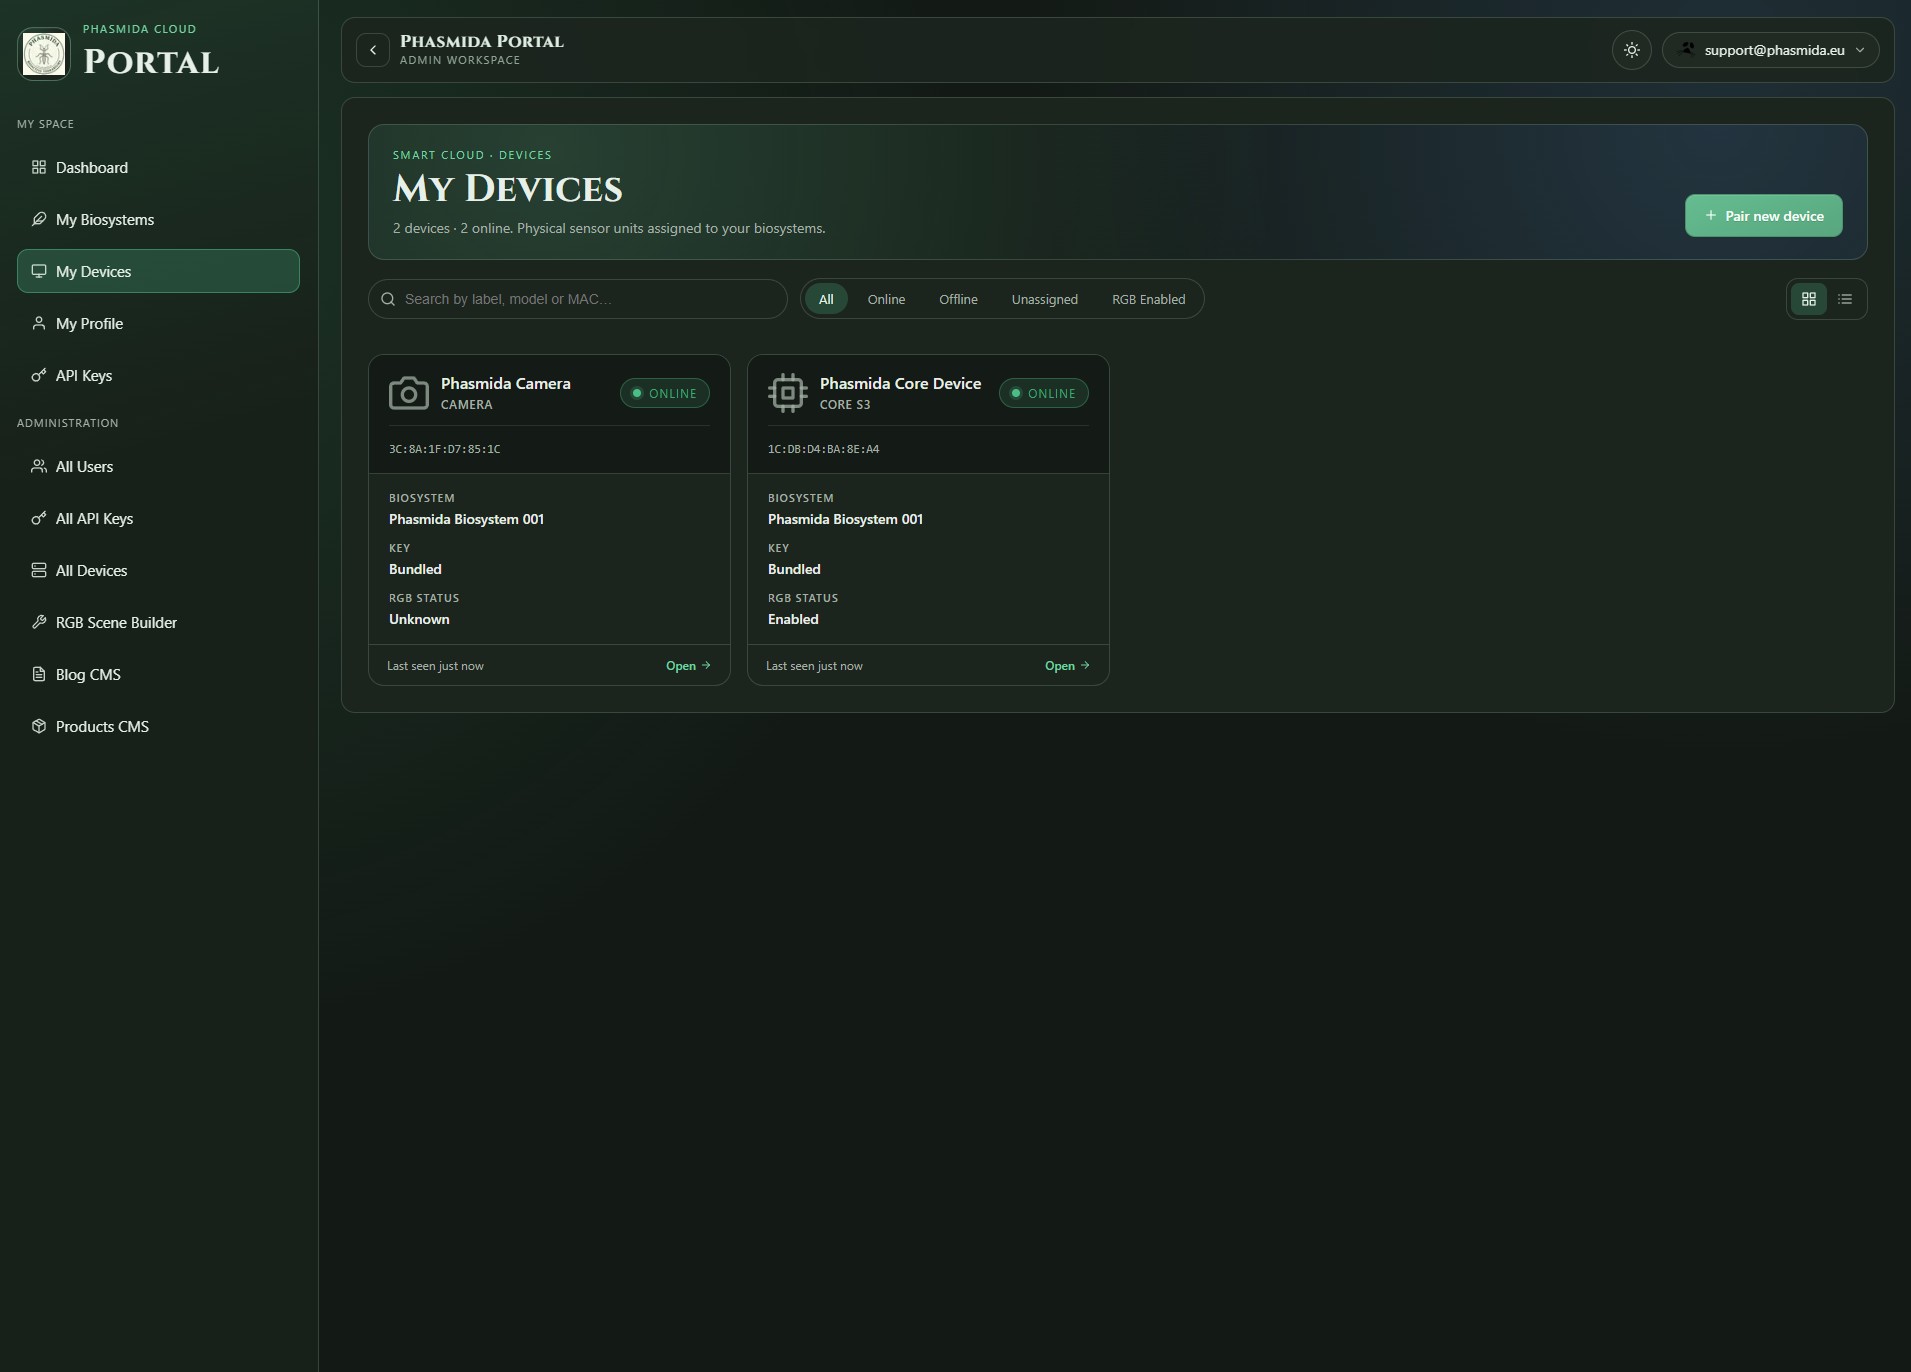
- My Devices list page
- device detail view
- status, identity, or assignment panels
- onboarding or management actions
Device Pairing: From Physical Hardware to Cloud Identity
One of the most important parts of the Smart Cloud user journey is pairing. This is the step where a physical device becomes a recognized, trusted entity inside the cloud platform.
Phasmida Smart Cloud supports two pairing models, and that dual model is one of its practical strengths. It allows the platform to remain simple for customers using standard Phasmida hardware, while also remaining open to more advanced or customized integrations.
Bundled Phasmida devices: API key and QR-based onboarding
Each standard Phasmida device is delivered with a bundled API key and a QR code for pairing. This creates a streamlined onboarding experience. Instead of requiring users to perform a complex technical setup, the device arrives with the identity material already prepared.
From the user’s point of view, this lowers friction significantly. The pairing flow becomes fast, intuitive, and repeatable:
- the user opens the relevant pairing workflow,
- scans the QR code,
- validates or confirms the device identity,
- links the device into the Smart Cloud environment.
That approach is especially valuable in commercial or scaled deployments where installation time matters. It reduces configuration overhead and minimizes the chance of manual setup errors.
Just as importantly, it makes the product feel complete. The onboarding process is not treated as a separate engineering task. It is part of the product experience.
Bring Your Own Hardware: integration through API credentials
The second model is equally important, even if it is aimed at a more technical user. Phasmida Smart Cloud also allows customers to connect their own compatible hardware to the platform using API-based integration.
In this model, the customer provides or uses an API key for authentication, and the pairing code is made available through the cloud administration pages. That pairing code acts as the bridge between external hardware and the cloud identity the platform needs in order to register and trust the device.
This model matters because it extends the platform beyond a closed hardware ecosystem. It means Phasmida Smart Cloud is not limited to prepackaged device distribution. It can also act as a cloud operating layer for partner devices, custom-built hardware, or customer-owned installations that need to connect into the same management surface.
That creates a useful balance between productization and openness:
- turnkey onboarding for bundled Phasmida hardware,
- configurable integration for advanced or external hardware.
From a business and product standpoint, that is a strong position. It supports ease of adoption without sacrificing extensibility.
Why pairing deserves attention in the article
Pairing is not just a technical procedure. It is the moment where trust, ownership, and usability intersect. If pairing is difficult, the platform feels difficult. If pairing is clear and reliable, the rest of the product becomes easier to adopt.
Phasmida Smart Cloud benefits from having a pairing model that matches two real-world scenarios:
- customers who want hardware that works out of the box,
- customers who want to connect their own hardware into the same cloud platform.
That flexibility is worth highlighting because it reflects a broader product philosophy: the platform is designed to support both simplicity and integration depth.
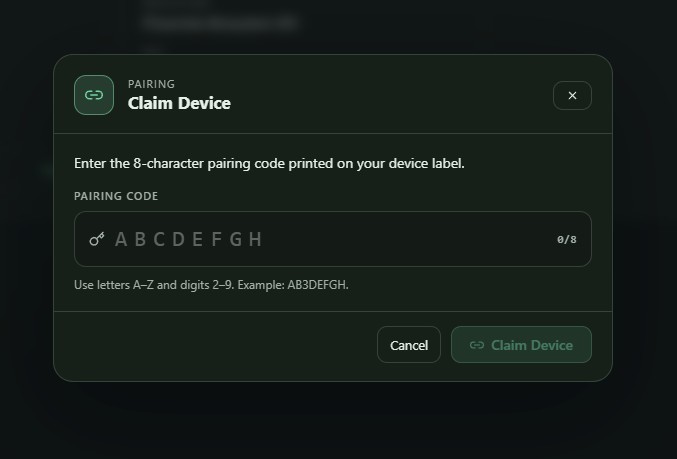
- device pairing landing or workflow screen
- QR code pairing screen for bundled devices
- API key-based onboarding or device connection screen
- Cloud Admin page showing pairing code or integration credentials
Why the Interface Is the Product Experience
It is easy to describe connected platforms in terms of sensors, controllers, APIs, and cloud architecture. All of that matters, but none of it changes the user experience unless the interface translates it into something understandable and useful.
That is where Phasmida Smart Cloud proves its value.
The Dashboard gives users operational awareness. My Biosystems gives them structure. The biosystem detail page gives them context and actionability. My Devices gives them control over the hardware layer. The pairing flow gives them a secure and manageable route from physical device to cloud identity.
Taken together, those components form a coherent product experience rather than a disconnected set of admin screens.
This is what makes the platform more than a technical control panel. It becomes an operating environment for biosystem management, one that helps users move from overview to detail without losing clarity.
In practice, that means Smart Cloud does not merely connect infrastructure. It makes infrastructure manageable.
Conclusion
Phasmida Smart Cloud stands out because it addresses a problem that many connected platforms only solve halfway. It is not enough to collect data from hardware. Users need a clear way to understand systems, organize environments, register devices, and onboard new installations without unnecessary complexity.
That is exactly what the interface is built to do.
The platform begins with a broad operational view through the Dashboard, narrows into structured environment management through My Biosystems, deepens into actionable monitoring through biosystem detail pages, and grounds the entire experience in a robust hardware layer through My Devices and flexible pairing workflows.
The result is a cloud platform that feels practical, scalable, and deployment-ready. It supports both standardized Phasmida hardware and custom device integration, while keeping the user experience centered on clarity.
For operators, integrators, and system owners, that combination is the real promise of Smart Cloud: one interface, one operational surface, and one reliable path from connected hardware to meaningful control.